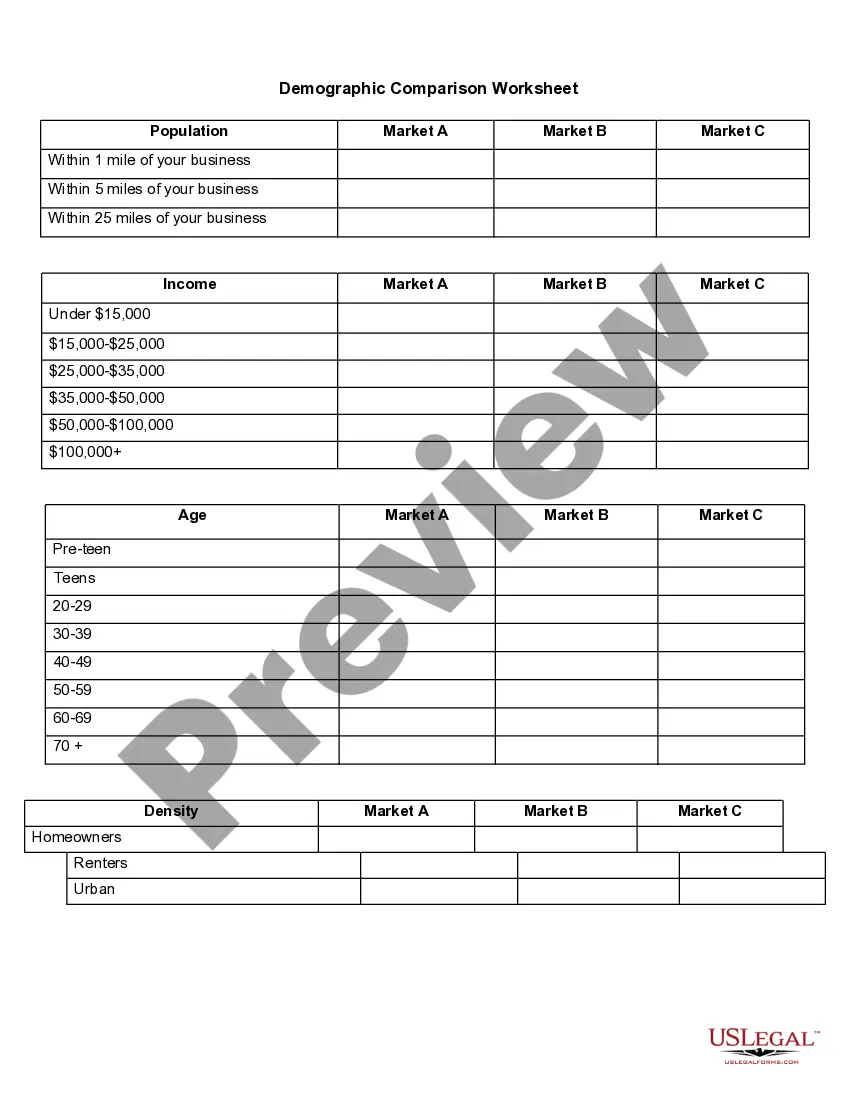
Arizona Demographic Comparison Worksheet is a comprehensive tool that enables individuals or organizations to analyze and compare various demographic indicators and statistics of different areas within the state of Arizona. It is specifically designed to provide a detailed understanding of the population composition, social characteristics, economic factors, and other important aspects that contribute to the state's demographics. This versatile worksheet can be utilized by researchers, policymakers, educators, and anyone interested in exploring and comparing demographic data at different geographic levels. By utilizing this worksheet, one can gain valuable insights into the similarities, differences, and trends across different regions, counties, cities, or neighborhoods in Arizona. The Arizona Demographic Comparison Worksheet offers a wide range of demographic indicators for comparison, including but not limited to: 1. Population data: Total population, age distribution, gender composition, racial and ethnic diversity, and population growth rates. 2. Socioeconomic information: Education levels, household income, poverty rates, employment status, and occupation distribution. 3. Housing statistics: Homeownership rates, housing costs, rental rates, and types of housing units. 4. Health indicators: Access to healthcare facilities, health insurance coverage, mortality rates, and prevalence of certain diseases or health conditions. 5. Education metrics: School enrollment rates, graduation rates, student-teacher ratios, and educational attainment levels. 6. Regional variations: Comparison of demographics between urban and rural areas, or analysis of specific regions within Arizona. 7. Historical trends: Tracking demographic changes over time through historical data and trend analysis. Types of Arizona Demographic Comparison Worksheets: 1. County Comparison Worksheet: Allows for the comparison of different counties within Arizona, providing a comprehensive overview of county-level demographics. 2. City Comparison Worksheet: Focuses on comparing various cities or towns within Arizona to gain insights into their unique demographic profiles. 3. Neighborhood Comparison Worksheet: Designed specifically for analyzing demographic differences at a neighborhood level, allowing for a more localized examination. 4. Rural vs. Urban Comparison Worksheet: Compares the demographic characteristics of urban areas against rural areas in Arizona, highlighting the differences between these two types of communities. In summary, the Arizona Demographic Comparison Worksheet is a valuable resource that provides a detailed and structured approach to analyzing and comparing various demographic factors within the state. It facilitates informed decision-making, research, and planning by offering a comprehensive overview of population, socioeconomic, housing, health, education, and other important demographic indicators across different geographic levels in Arizona.
Arizona Demographic Comparison Worksheet
Description
How to fill out Arizona Demographic Comparison Worksheet?
Are you presently inside a situation that you require files for both organization or personal uses almost every day? There are a variety of legitimate record templates available online, but getting types you can rely on isn`t straightforward. US Legal Forms provides thousands of form templates, much like the Arizona Demographic Comparison Worksheet, that happen to be composed to satisfy federal and state requirements.
If you are previously informed about US Legal Forms web site and have an account, basically log in. Afterward, you can acquire the Arizona Demographic Comparison Worksheet format.
Unless you offer an accounts and would like to begin to use US Legal Forms, follow these steps:
- Discover the form you want and make sure it is for your proper city/area.
- Make use of the Review switch to analyze the form.
- Browse the description to actually have chosen the appropriate form.
- When the form isn`t what you are looking for, utilize the Look for industry to get the form that suits you and requirements.
- Whenever you get the proper form, simply click Buy now.
- Choose the prices program you need, fill out the desired information and facts to create your account, and buy the order making use of your PayPal or charge card.
- Pick a handy file file format and acquire your copy.
Get each of the record templates you possess bought in the My Forms food list. You can get a extra copy of Arizona Demographic Comparison Worksheet whenever, if needed. Just click the needed form to acquire or print out the record format.
Use US Legal Forms, by far the most comprehensive collection of legitimate kinds, to conserve time as well as stay away from faults. The services provides skillfully produced legitimate record templates which can be used for an array of uses. Produce an account on US Legal Forms and begin generating your lifestyle a little easier.
Form popularity
FAQ
Ancestry. According to the 20052007 American Community Survey conducted by the U.S. Census Bureau, White Americans made up 76.4% of Arizona's population; of which 59.6% were Non-Hispanic Whites. Black people or African Americans made up 3.4% of Arizona's population; of which 3.3% were non-Hispanic black people.
In Arizona in 2020, 31.9% of the total population was Hispanic, 53.8% were white, 4.6% were black, 3.9% were American Indian/Alaska Native and 3.7% were Asian/Pacific Islander. The demographic distribution of women and children in a state, county or city can have an impact on the rates of birth outcomes in that area.
Demographics. Hispanics made up 32% of Arizona's population. The largest ancestry group in Arizona is Mexican (26%). The southern and central parts of the state are predominantly Mexican American, especially in Santa Cruz County and Yuma County near the Mexican border.
The 5 largest ethnic groups in Phoenix, AZ are White (Non-Hispanic) (41.4%), White (Hispanic) (35.3%), Black or African American (Non-Hispanic) (6.89%), Other (Hispanic) (5.57%), and Asian (Non-Hispanic) (3.91%). 37.9% of the households in Phoenix, AZ speak a non-English language at home as their primary language.
Arizona DemographicsWhite: 77.22%Other race: 6.53%Black or African American: 4.50%Native American: 4.50%Two or more races: 3.73%Asian: 3.31%Native Hawaiian or Pacific Islander: 0.21%
Phoenix Demographics According to the most recent ACS, the racial composition of Phoenixwas: White: 72.87% Other race: 10.01% Black or African American: 7.12%
The 5 largest ethnic groups in Arizona are White (Non-Hispanic) (54%), White (Hispanic) (24.4%), Other (Hispanic) (4.87%), Black or African American (Non-Hispanic) (4.38%), and American Indian & Alaska Native (Non-Hispanic) (3.97%).
In Arizona in 2020, 31.9% of the total population was Hispanic, 53.8% were white, 4.6% were black, 3.9% were American Indian/Alaska Native and 3.7% were Asian/Pacific Islander. The demographic distribution of women and children in a state, county or city can have an impact on the rates of birth outcomes in that area.
The 5 largest ethnic groups in Arizona are White (Non-Hispanic) (54%), White (Hispanic) (24.4%), Other (Hispanic) (4.87%), Black or African American (Non-Hispanic) (4.38%), and American Indian & Alaska Native (Non-Hispanic) (3.97%).