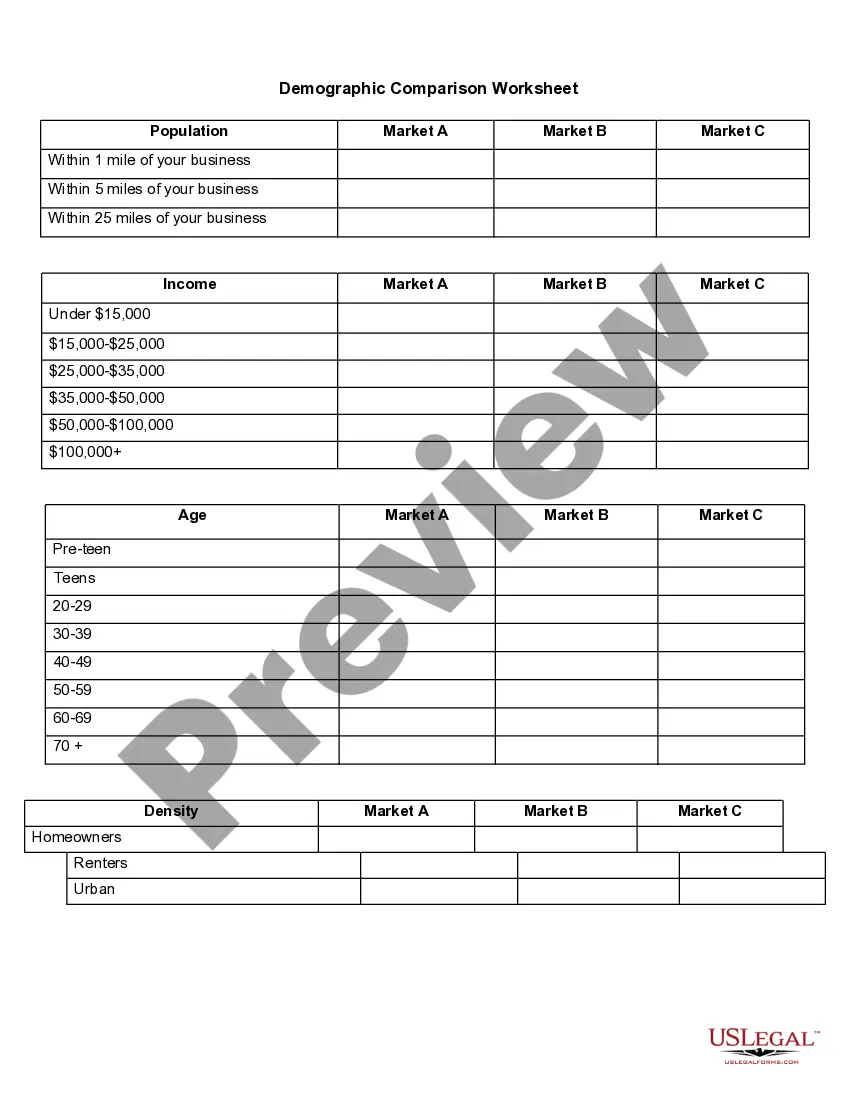
Title: California Demographic Comparison Worksheet: A Comprehensive Review and Types Explained Introduction: The California Demographic Comparison Worksheet is a valuable tool that helps individuals, researchers, and policymakers analyze and compare various demographic data sets within the state of California. This detailed description aims to provide an overview of this worksheet, outlining its purpose, key features, and potential applications. Additionally, it will highlight the different types of California Demographic Comparison Worksheets available. Key Features and Purpose: The California Demographic Comparison Worksheet is designed to offer an organized and user-friendly platform for comparing demographic indicators across different regions, cities, or counties within California. By consolidating essential demographic data into a single document, this worksheet enables users to identify trends, disparities, and commonalities within various geographical areas. This comprehensive tool typically includes a range of demographic data categories, such as population size, age distribution, gender ratio, ethnic composition, income levels, education levels, housing characteristics, employment rates, and other relevant variables. Each category is supplemented with accurate and up-to-date statistics, providing users with a reliable basis for analysis and comparison. Types of California Demographic Comparison Worksheets: 1. County-Level Demographic Comparison Worksheet: This variant of the California Demographic Comparison Worksheet focuses on comparing and contrasting demographic data across different counties within the state. It allows users to examine variations in population, socio-economic characteristics, and other factors at a county level, aiding in regional analysis and policy development. 2. City-Level Demographic Comparison Worksheet: This type of California Demographic Comparison Worksheet narrows down the scope to compare demographic indicators specifically at the city level. It enables users to understand the unique dynamics of different cities within California by analyzing and contrasting various demographic variables. 3. Regional Demographic Comparison Worksheet: The Regional Demographic Comparison Worksheet provides a broader perspective by grouping multiple counties or cities within a specific region. This type of worksheet is particularly useful for evaluating demographic trends and differences across larger geographical areas, helping researchers identify patterns that extend beyond individual counties or cities. Applications: The California Demographic Comparison Worksheet serves various purposes and can be employed by different user groups, including: 1. Researchers and Academics: Researchers can benefit from the worksheet's data-driven approach to investigate demographic trends, develop research hypotheses, and support empirical analyzes. 2. Policy Analysts and Planners: Policymakers and analysts can utilize the worksheet to assess inequalities, guide resource allocation, and design targeted policies catering to specific demographic needs in different California regions. 3. Businesses and Market Researchers: Businesses can utilize the worksheet to gain insights into the demographic characteristics of various regions or cities in California, aiding in market segmentation, targeted marketing campaigns, and strategic planning. 4. Individuals and Students: The worksheet can serve as an educational tool, helping individuals gain a deeper understanding of the demographic diversity within California and encouraging data-driven decision-making. Conclusion: The California Demographic Comparison Worksheet is a powerful resource for analyzing, comparing, and understanding the demographic composition of various regions, counties, and cities within California. Its comprehensive and user-friendly design, coupled with accurate data, makes it an invaluable tool for researchers, policymakers, businesses, and individuals seeking to make informed decisions based on demographic insights.
California Demographic Comparison Worksheet
Description

How to fill out California Demographic Comparison Worksheet?
Finding the right legitimate papers format can be a have a problem. Needless to say, there are plenty of templates available on the net, but how will you get the legitimate form you need? Make use of the US Legal Forms internet site. The support provides a huge number of templates, like the California Demographic Comparison Worksheet, that can be used for company and private requires. Every one of the kinds are checked by pros and meet federal and state specifications.
When you are already listed, log in for your accounts and click the Down load key to have the California Demographic Comparison Worksheet. Utilize your accounts to search through the legitimate kinds you have acquired in the past. Visit the My Forms tab of the accounts and have yet another version of the papers you need.
When you are a new customer of US Legal Forms, allow me to share simple directions that you should comply with:
- Initial, ensure you have chosen the correct form for your personal town/area. You are able to check out the form while using Preview key and browse the form outline to guarantee it is the best for you.
- In case the form does not meet your requirements, take advantage of the Seach discipline to obtain the proper form.
- Once you are sure that the form would work, go through the Purchase now key to have the form.
- Select the costs plan you desire and type in the essential details. Design your accounts and purchase an order with your PayPal accounts or charge card.
- Select the file file format and download the legitimate papers format for your system.
- Full, edit and print and indicator the obtained California Demographic Comparison Worksheet.
US Legal Forms is the greatest local library of legitimate kinds where you will find various papers templates. Make use of the service to download skillfully-produced paperwork that comply with status specifications.
Form popularity
FAQ
U.S. Government DataU.S. Bureau of the Census. . Bureau of Labor Statistics. Population Statistics.County Business Patterns.Social Security Administration (Office of Policy)Statistical Abstract of the United States.White House Briefing Room.More items...
Population (up 7.4% to 331.4 million). Race and ethnicity (White alone 61.6%; Black alone 12.4%; Hispanic 18.7%; Asian alone 6%; American Indian and Alaska Native alone 1.1%; Native Hawaiian and Other Pacific Islander alone 0.2%; Some Other Race alone 8.4%; Two or More Races 10.2%).
No race or ethnic group constitutes a majority of California's population: 39% of state residents are Latino, 35% are white, 15% are Asian American or Pacific Islander, 5% are Black, 4% are multiracial, and fewer than 1% are Native American or Alaska Natives, according to the 2020 Census.
African-American Californians or Black Californians are residents of the state of California who are of African ancestry. According to 2019 U.S. Census Bureau estimates, those identified solely as African American or black constituted 5.8% or 2,282,144 residents in California.
For the first time in state history, the Hispanic or Latino population became the largest racial or ethnic group in California, while the share of white people dropped from 40.1% to 34.7%. The Hispanic or Latino community now represents 39.4% of Californians a jump from 37.6% in 2010.
California DemographicsWhite: 59.70%Asian: 14.49%Other race: 13.95%Black or African American: 5.79%Two or more races: 4.89%Native American: 0.77%Native Hawaiian or Pacific Islander: 0.40%
No race or ethnic group constitutes a majority of California's population: 39% of state residents are Latino, 35% are white, 15% are Asian American or Pacific Islander, 5% are Black, 4% are multiracial, and fewer than 1% are Native American or Alaska Natives, according to the 2020 Census.
No race or ethnic group constitutes a majority of California's population: 39% of state residents are Latino, 35% are white, 15% are Asian American or Pacific Islander, 5% are Black, 4% are multiracial, and fewer than 1% are Native American or Alaska Natives, according to the 2020 Census.
For the first time in state history, the Hispanic or Latino population became the largest racial or ethnic group in California, while the share of white people dropped from 40.1% to 34.7%. The Hispanic or Latino community now represents 39.4% of Californians a jump from 37.6% in 2010.