Michigan Demographic Comparison Worksheet is a comprehensive tool used to analyze and compare various demographic factors in different regions of Michigan. This worksheet helps individuals, researchers, and policymakers gain a better understanding of the social, economic, and cultural characteristics of different areas in Michigan. By highlighting the similarities and differences in demographics across regions, this worksheet aids in making informed decisions regarding resource allocation, public policy, market research, and community development. Key factors covered in the Michigan Demographic Comparison Worksheet include population size, age distribution, gender ratio, racial and ethnic composition, educational attainment, income levels, employment rates, housing patterns, healthcare services, and crime rates. By gathering data from reliable sources, such as the U.S. Census Bureau, state government agencies, and research institutions, this worksheet provides an accurate and up-to-date snapshot of the demographic landscape in Michigan. This tool is not limited to a single type, as there may be different versions or variations of the Michigan Demographic Comparison Worksheet depending on the specific purpose or target audience. These variations could include worksheets tailored for specific industries, such as healthcare, education, or economic development, which focus on demographic factors relevant to those sectors. Additionally, there may be worksheets specifically designed for academic research or community planning, offering more detailed and intricate analysis of the demographic trends and patterns within Michigan. Overall, the Michigan Demographic Comparison Worksheet is an invaluable resource for anyone seeking comprehensive information about the demographic makeup of different regions within Michigan. Whether for academic, professional, or personal use, this worksheet facilitates informed decision-making, strategic planning, and a better understanding of the diverse communities that form the state of Michigan.
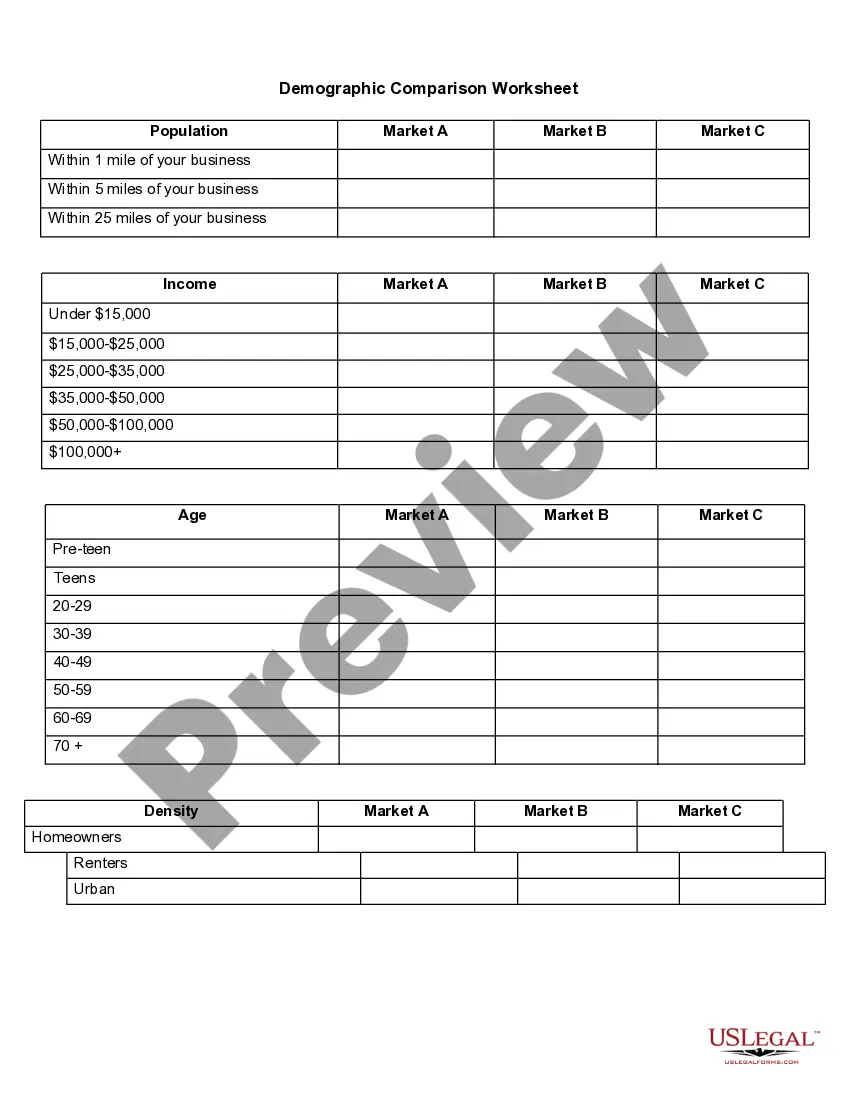
Michigan Demographic Comparison Worksheet
Description
How to fill out Michigan Demographic Comparison Worksheet?
If you have to complete, down load, or print out legitimate file templates, use US Legal Forms, the biggest assortment of legitimate types, which can be found on the Internet. Take advantage of the site`s simple and easy handy lookup to get the files you require. Various templates for organization and specific uses are categorized by types and suggests, or search phrases. Use US Legal Forms to get the Michigan Demographic Comparison Worksheet with a number of click throughs.
Should you be previously a US Legal Forms buyer, log in in your accounts and click the Download key to get the Michigan Demographic Comparison Worksheet. Also you can accessibility types you previously delivered electronically inside the My Forms tab of your own accounts.
If you work with US Legal Forms the first time, refer to the instructions below:
- Step 1. Ensure you have chosen the shape for the correct metropolis/nation.
- Step 2. Take advantage of the Review solution to examine the form`s content material. Do not neglect to see the explanation.
- Step 3. Should you be not satisfied together with the develop, take advantage of the Lookup industry near the top of the display to locate other variations of the legitimate develop design.
- Step 4. Upon having identified the shape you require, go through the Get now key. Pick the costs strategy you like and include your references to register on an accounts.
- Step 5. Procedure the transaction. You can utilize your credit card or PayPal accounts to finish the transaction.
- Step 6. Find the file format of the legitimate develop and down load it on your own system.
- Step 7. Complete, revise and print out or signal the Michigan Demographic Comparison Worksheet.
Every single legitimate file design you get is your own property permanently. You possess acces to every single develop you delivered electronically inside your acccount. Click on the My Forms segment and decide on a develop to print out or down load once again.
Compete and down load, and print out the Michigan Demographic Comparison Worksheet with US Legal Forms. There are thousands of specialist and status-particular types you may use to your organization or specific requirements.
Form popularity
FAQ
Michigan Demographics White: 78.41% Black or African American: 13.79% Asian: 3.13%
The 5 largest ethnic groups in Michigan are White (Non-Hispanic) (74.7%), Black or African American (Non-Hispanic) (13.5%), White (Hispanic) (3.56%), Asian (Non-Hispanic) (3.26%), and Two+ (Non-Hispanic) (2.64%).
Texas has the largest Black state population With more than 3.9 million Black people in 2019, Texas is home to the largest Black population in the U.S. Florida has the second largest population at 3.8 million, and Georgia is home to 3.6 million Black people.
The census recorded 635,315 people in 2020 who said they are multiracial, representing 6% of Michigan's population. This category included 230,319 people 10 years earlier, representing 2% of the population. White people are by far Michigan's largest ethnic group, followed by Black people and Asian Americans.
States with the Highest Black PopulationTexas has the highest Black population in the United States of 3,936,669, about 14% of Texas's total population. Texas is the second-most diverse state in the U.S. Following Texas is Florida with 3,867,495 (18%), New York with 3,763,977 (19%), and Georgia with 3,549,349 (34%).
New York city had the largest number of people reporting as Black with about 2.3 million, followed by Chicago, 1.1 million, and Detroit, Philadelphia and Houston, which had between 500,000 and 1 million each.
People who identified themselves as white as their only race decreased from 79% of Michigan's population to 74% in the last decade. The 2020 Census counted 7.4 million people who answered white only and 599,666 who identified as white and another race - together those amount to 80% of the population in 2020.
Oklahoma: Home to More Historically All-Black Towns than Any Other U.S. State.
Michigan DemographicsWhite: 78.41% Black or African American: 13.79% Asian: 3.13% Two or more races: 2.92%
The 5 largest ethnic groups in Michigan are White (Non-Hispanic) (74.7%), Black or African American (Non-Hispanic) (13.5%), White (Hispanic) (3.56%), Asian (Non-Hispanic) (3.26%), and Two+ (Non-Hispanic) (2.64%). 10% of the households in Michigan speak a non-English language at home as their primary language.