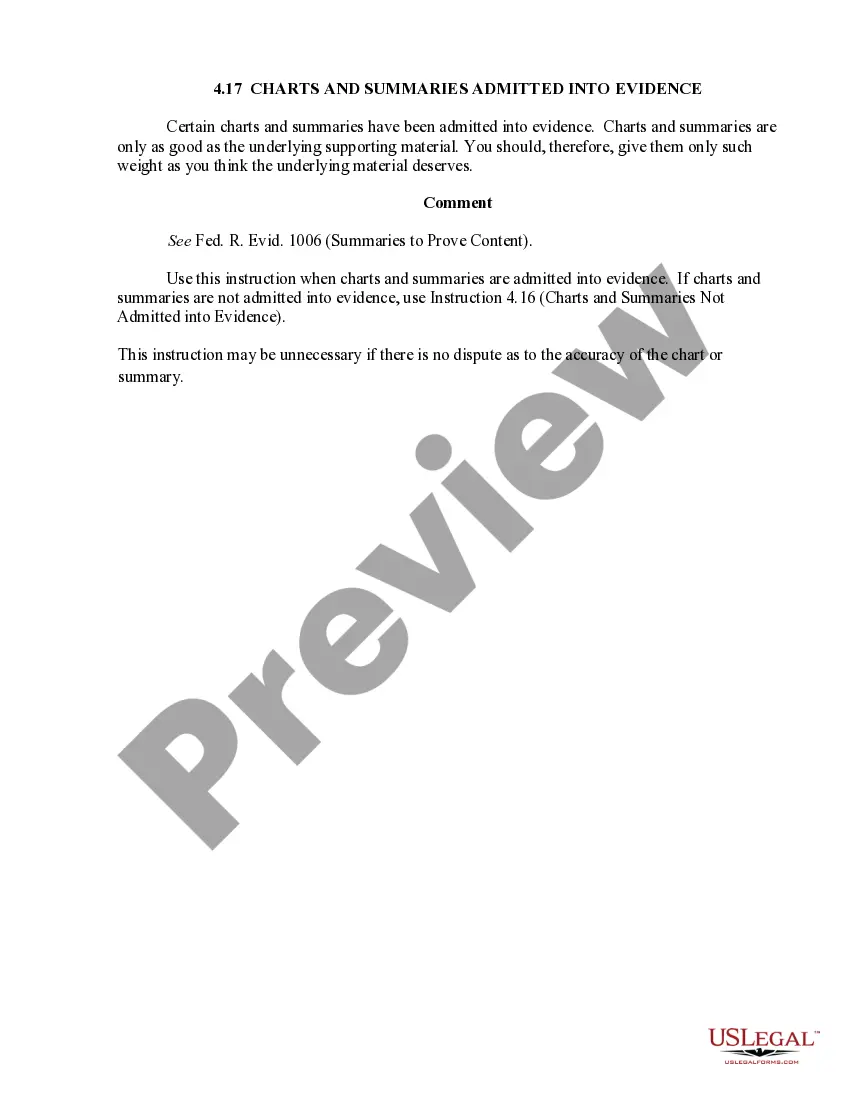
2.15 Charts and Summaries in Evidence is a method used by courts to organize and present evidence. It involves presenting evidence in the form of charts, tables, graphs, and summaries. Charts are visual representations of data that can help the judge and jury better understand the facts and evidence presented. Summaries are written documents that provide an overview of the evidence and arguments. Types of 2.15 Charts and Summaries in Evidence include bar graphs, line graphs, pie charts, tables, bullet points, and narrative summaries.
2.15 Charts and Summaries in Evidence
State:
Multi-State
Control #:
US-JURY-9THCIR-2-15
Format:
Rich Text
Instant download
This website is not affiliated with any governmental entity
Public form
Description
Sample Jury Instructions from the 9th Circuit Federal Court of Appeals. http://www3.ce9.uscourts.gov/jury-instructions/

How to fill out 2.15 Charts And Summaries In Evidence?
How much time and resources do you usually spend on composing official paperwork? There’s a better opportunity to get such forms than hiring legal experts or spending hours searching the web for a suitable template. US Legal Forms is the top online library that offers professionally drafted and verified state-specific legal documents for any purpose, such as the 2.15 Charts and Summaries in Evidence.
To get and prepare an appropriate 2.15 Charts and Summaries in Evidence template, adhere to these simple instructions:
- Examine the form content to ensure it complies with your state laws. To do so, check the form description or utilize the Preview option.
- In case your legal template doesn’t meet your requirements, locate a different one using the search bar at the top of the page.
- If you are already registered with our service, log in and download the 2.15 Charts and Summaries in Evidence. If not, proceed to the next steps.
- Click Buy now once you find the right document. Select the subscription plan that suits you best to access our library’s full service.
- Create an account and pay for your subscription. You can make a payment with your credit card or via PayPal - our service is absolutely secure for that.
- Download your 2.15 Charts and Summaries in Evidence on your device and fill it out on a printed-out hard copy or electronically.
Another advantage of our service is that you can access previously purchased documents that you safely store in your profile in the My Forms tab. Get them at any moment and re-complete your paperwork as frequently as you need.
Save time and effort completing official paperwork with US Legal Forms, one of the most reliable web services. Sign up for us today!