Vermont Demographic Comparison Worksheet
Description


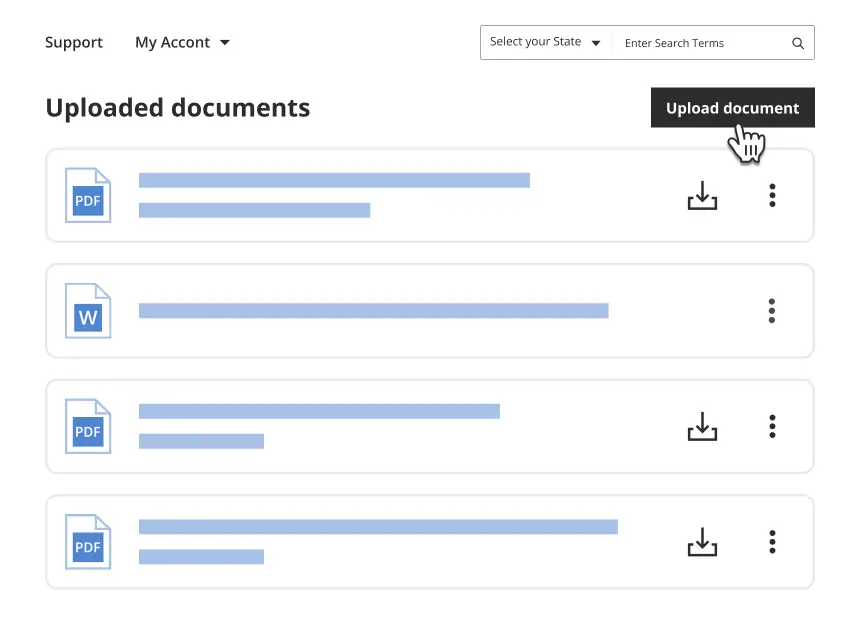
Get your form ready online
Our built-in tools help you complete, sign, share, and store your documents in one place.
Make edits, fill in missing information, and update formatting in US Legal Forms—just like you would in MS Word.
Download a copy, print it, send it by email, or mail it via USPS—whatever works best for your next step.
Sign and collect signatures with our SignNow integration. Send to multiple recipients, set reminders, and more. Go Premium to unlock E-Sign.
If this form requires notarization, complete it online through a secure video call—no need to meet a notary in person or wait for an appointment.
We protect your documents and personal data by following strict security and privacy standards.
Looking for another form?
How to fill out Demographic Comparison Worksheet?
US Legal Forms - one of the largest collections of legal templates in the United States - offers a broad selection of legal document templates you can download or print.
By utilizing the site, you can access thousands of forms for business and personal purposes, categorized by types, states, or keywords. You can quickly find the latest versions of forms like the Vermont Demographic Comparison Worksheet in moments.
If you already have an account, Log In and download the Vermont Demographic Comparison Worksheet from the US Legal Forms library. The Download button will be visible on each form you view. You can access all previously downloaded forms in the My documents section of your account.
Every template you add to your account does not have an expiration date and is yours indefinitely. Therefore, to download or print another version, simply visit the My documents section and click on the form you need.
Gain access to the Vermont Demographic Comparison Worksheet with US Legal Forms, one of the most extensive collections of legal document templates. Utilize thousands of professional and state-specific templates that fulfill your business or personal needs and requirements.
- Ensure you have selected the correct form for your city/state. Click on the Review button to review the form's content. Check the form description to confirm you have selected the appropriate template.
- If the form does not meet your requirements, use the Search box at the top of the screen to find the one that does.
- If you are satisfied with the form, confirm your selection by clicking on the Get now button. Then, select the pricing plan you desire and provide your details to register for an account.
- Process the payment. Use your credit card or PayPal account to complete the transaction.
- Select the format and download the form to your device.
- Edit. Fill out, modify, print, and sign the downloaded Vermont Demographic Comparison Worksheet.
Form popularity
FAQ
Chittenden County #1 Best Counties to Live in Vermont.
Instead, intersecting portions of the pre-existing towns of New Haven, Panton and Ferrisburg at the Otter Creek Falls were combined to form Vergennes. It is the smallest city by population in Vermont.
Top 5 Vermont Towns to Live inMontpelier, VT. No matter where you're from, Montpelier, VT is one of the cutest small towns to call home away from home.Barre, VT. If you think you can't live in Montpelier because of its small population, then you might want to consider Barre, VT.Northfield, VT.Stowe, VT.Woodstock.
1. Shelburne. Welcome to the safest city in Vermont, Shelburne, sitting peacefully near Lake Champlain, at the northwest border of the state.
Vermont remains the second whitest state in the country, but the state's minority population is growing, data released Thursday U.S. Census Bureau showed. The data showed the Hispanic population in Vermont grew by 68.4%, about 6,300 people, between 2010 and 2020, the third largest percentage increase in the country.
Vermont DemographicsWhite: 94.16% Two or more races: 2.02% Asian: 1.68% Black or African American: 1.36%
For the 2000 census, only one person resided in Lost Springs, Wyoming. According to the United States Census Bureau, the town is one of only four places in the United States to have a population of one person.
The best places to live in Vermont include Burlington, Rutland, Montpelier, Bennington and Brattleboro. The state has 14 private colleges and five University of Vermont campuses.
The 20 Worst Places to Live in VermontBurlington, Vermont. Only in Your State goes down the list of a few of the most dangerous cities in Vermont.Northfield, Vermont.Brattleboro, Vermont.Lyndonville, Vermont.Winooski, Vermont.Rutland, Vermont.Dover, Vermont.Milton, Vermont.More items...
The 5 largest ethnic groups in Vermont are White (Non-Hispanic) (92.5%), Two+ (Non-Hispanic) (2.34%), Asian (Non-Hispanic) (1.36%), White (Hispanic) (1.32%), and Black or African American (Non-Hispanic) (1.3%).